2021 Year-End Summary
When discussing this period, future economists will lump 2020 and 2021 together. Hopefully, it’ll be just these two years.
What history may blur is how different 2020 and 2021 were. 2020 featured shutdowns, massive government stimulus, and breakneck market volatility followed by a steady climb.
Last year was the aftermath. Pandemic policies lead to supply chain shortages and inflation. Flush consumers reemerged eager to spend. The market’s ascent from March 2020’s depths continued, with the same seeming insulation from a noisy and chaotic world.
Lesser challenges have derailed past bull markets. And yet, we’re thirteen years into the post-Great Recession uptrend. All but three of those years have featured double-digit S&P 500 returns. The last three years have been the best run since the late 1990s.
What a wonderful time to be an investor, right?
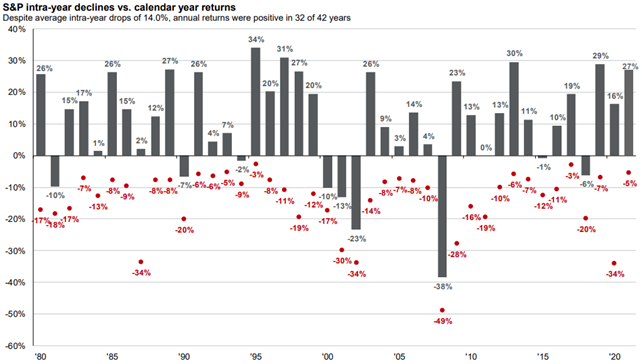
It can seem trite to hear us say versions of “stay the course.” Yet, the above chart demonstrates how gut-wrenching that tactic can be.
At all times, and especially the last two years, investing required perseverance. You had to tune out the noise, suppress your impulses, and focus on the long-term plan.
With the new year, we hope you take pride in what your portfolio has accomplished. You endured another challenging year. Your portfolio benefited. And you progressed toward your long-term goals. Let’s further refine and develop the conversation around these goals in the new year.
With the current wave of Covid cases, we have paused in-person meetings. We hope to resume them shortly. We hope that everyone stays healthy and that we see you all in person in 2022!
U.S. Stocks
The final stats for U.S. stocks in 2021 paint an idyllic picture.
The S&P 500 was up 28.7% including dividends. On seventy days, the index reached all-time highs. That’s more all-time highs than happened in the 1970s and 2000s combined.
The largest peak-to-trough loss was 5%, which the next chart shows is far below the typical downside volatility.
In sum, U.S. stocks produced a nearly 30% return, chugged higher, and there was barely a meaningful pullback.
To summarize many questions that we receive – how can the stock market be so healthy in the middle of a pandemic?!
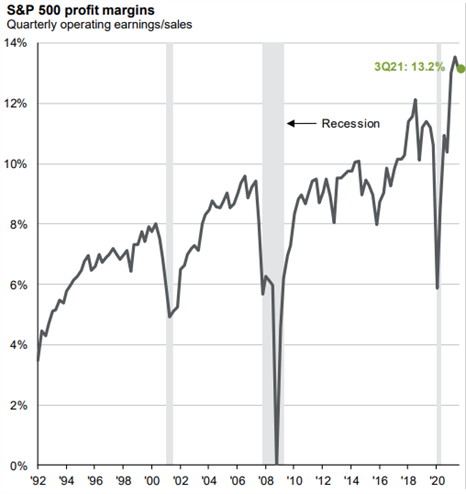
There are many contributing factors, but the next chart may be the most potent.
The economic shutdown put an extraordinary squeeze on businesses. Then, through a combination of fortune (stimulus) and skill (ingenuity), corporations snapped back to pull in record high profits.
With pocketbooks bolstered and asset prices ascendant, companies could take inflation in stride. They raise prices, and consumers continue to hand over their money.
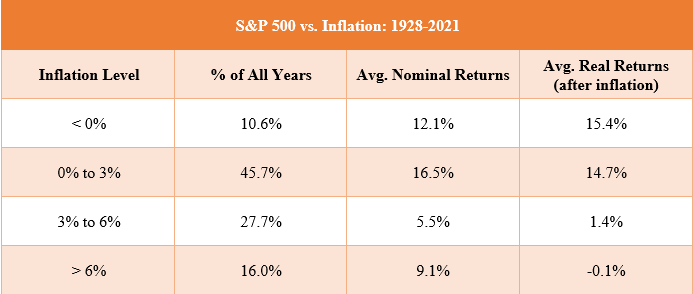
However, their ability to do this may be short-lived. Though the stock market is a great inflation hedge over the long run, high inflation can be trouble in the coming years.
Whether inflation subsides may be the top issue for markets in 2022.
International Stocks
International stocks produced a 9.0% total return in 2021. This follows a 10.7% return in 2020 and 21.8% return in 2019. These are strong results in every sense other than relative to U.S. stocks.
Foreign stocks have vexed globally diversified investors for much of the last several years. Investors are weary from wondering when the pendulum will swing in foreign stocks’ favor.
Vanguard, the world’s second largest asset manager, renewed the conversation recently with their latest expected return forecasts.
Vanguard would be the first to tell you to take these projections with a giant grain of salt. The above numbers are median results from thousands of scenarios, many of which show vastly different outcomes. Ten years ago, Vanguard’s projections significantly underestimated U.S. returns and overestimated foreign returns.
Still, the above reflects how much of a potential headwind high U.S. stock valuations may be after thirteen years of climbing. Valuations are a poor timing signal, but the most reliable indicator we have of future long-term returns.
Bonds
Like 2020, 2021 showed the treachery of mixing investing with macro forecasts.
In 2020, pandemic clairvoyance would have led most investors astray (and likely into a cash bunker).
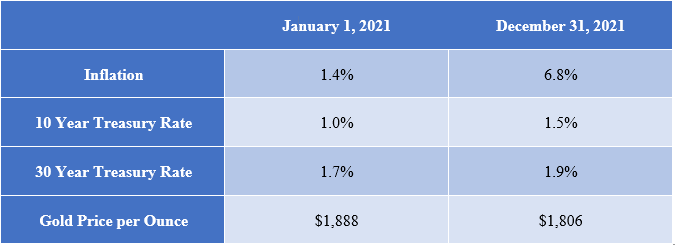
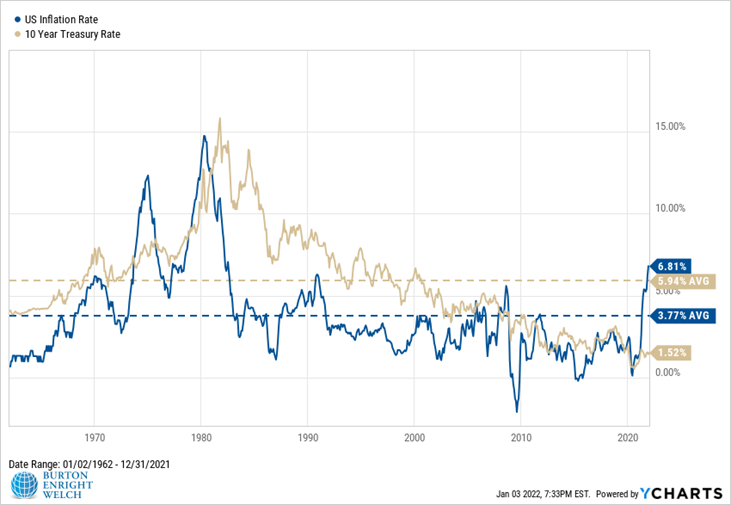
In 2021, an accurate prediction about higher inflation would have done the same. Higher inflation typically correlates with a corresponding leap in interest rates and gold prices. And yet …
We don’t mean to deride forecasters too much because the above truly is surprising. Currently, treasury bond investors accept a return far below what they lose in purchasing power. This is not in the textbooks.
Treasuries were not the only investments with shrinking yields amid rising inflation. High-yield corporate bonds (“junk bonds”) have never paid less, and commercial real estate yields are near their all-time lows.
Income-seeking investors face lackluster options. We’re skeptical that the potential payoff in riskier assets like junk bonds is worth the additional risk.
With lower yields over the past few years, our bond portfolios have deemphasized income-production and bolstered other features – diversification against stocks and capital preservation. By reducing risk with bonds, we could add to stocks without greatly increasing the risk profile of the portfolio.
The large disconnect between interest rates and inflation further undermines the case for bonds. Nonetheless, even if this disconnect persists, we plan to maintain a major allocation to bonds in our portfolios.
Bonds are a stock volatility hedge and still pay meaningfully more than cash. Their stability is vital during stock declines. They allow us to meet our clients’ distribution needs without selling stocks. And we can sell bonds and be opportunistic stock purchasers like in March 2020.
We continue to evaluate how much to allocate to bonds and the shape of that allocation. We will update as changes arise.
Burton Enright Welch is an independent, fee-only financial planning and investment management firm based out of Walnut Creek, California.


