The week since President Trump’s April 2 tariff announcement has been a whirlwind. We wanted to share some charts that capture the market’s dramatic moves.
And in case you missed it, last week we wrote about Tariffs and Diversification’s revival.
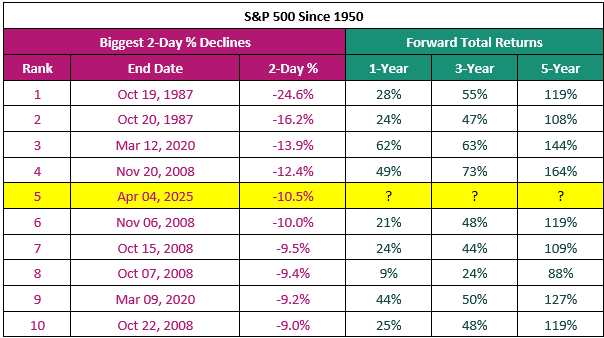
Thursday April 3, the S&P 500 fell 4.9%. It fell another 6.0% on Friday April 4. This was the fifth worst two-day decline for the index since 1950. But also note – the 1, 3, and 5-year returns after past declines are all positive.
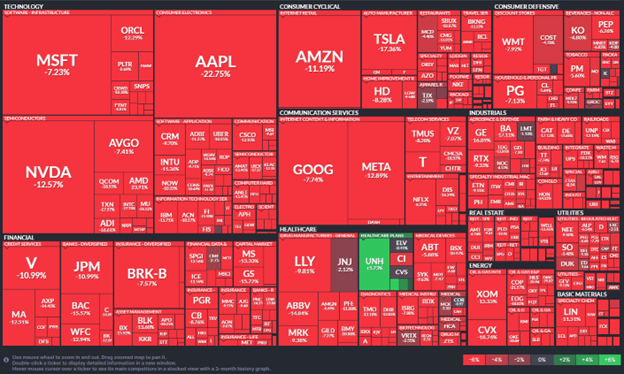
The market fell Monday and Tuesday as well. Four days post-announcement, nearly every stock in the S&P 500 was negative.
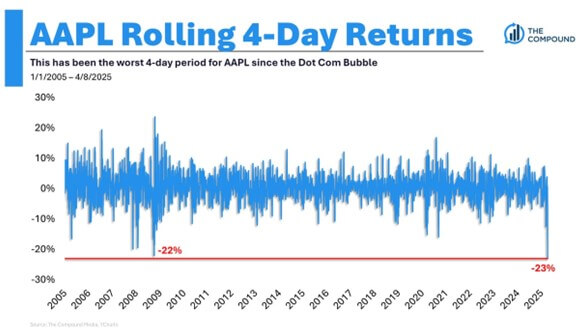
Even stocks that previously seemed infallible – like Apple – have taken a hit.
Then, on Wednesday, President Trump announced a 90-day pause on most tariffs, apart from those targeting China, which he increased. The market responded euphorically, interpreting a potential sign of flexibility after previous tariff signaling was steadfast and uncompromising.
The S&P 500 enjoyed its third largest daily gain. Nearly all the rally came after the 10:15 a.m. PT announcement (much of it immediately after).
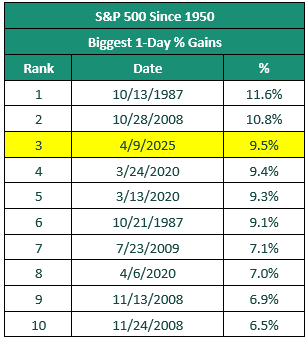
Thursday was another rocky and large down day. We could show another chart, but at this point we’re tired and suspect you are too.
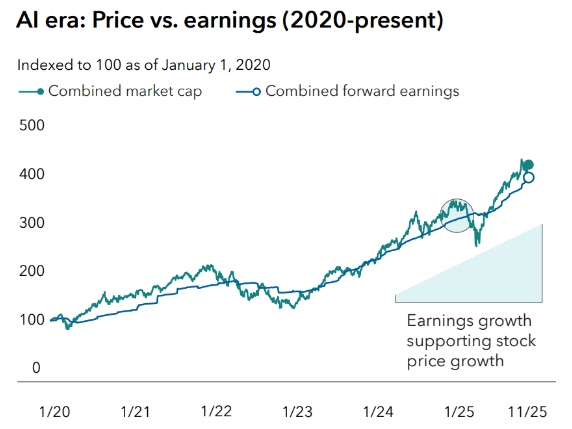
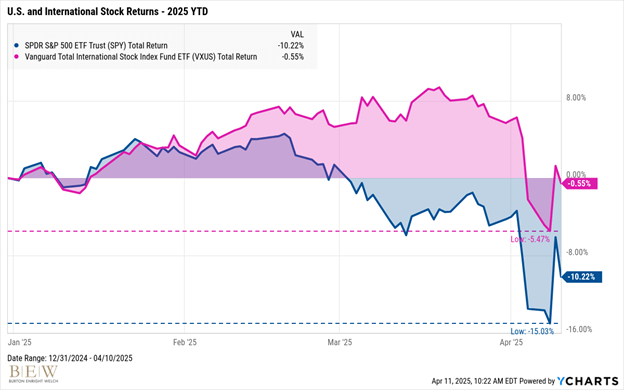
We’ll end with some big picture charts. Here is where U.S. and global stocks are for the year through April 10. We expect that the declines are shallower than in many investors’ minds.
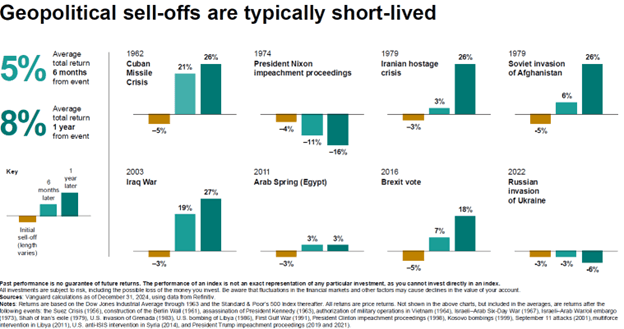
While last week’s events are unprecedented, history still offers analogies to past periods of geopolitical turmoil.
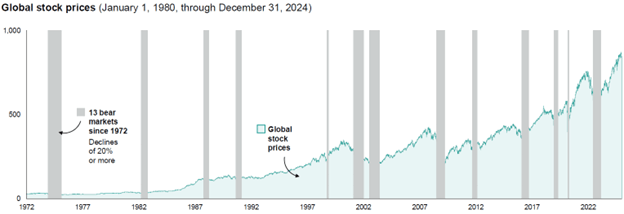
Over the past 50+ years, markets have delivered remarkable gains—even amid recurring bear markets, many of which felt just as dramatic and dire as today.
We understand that the past week has been a stressful and unsettling time for investors. As always, please reach out to your advisor if you have any questions or concerns.
Get the BEW Newsletter Direct to Your Inbox
Stay informed with timely perspectives and market insights from the BEW Invest team.